
Illiteracy in Mexico has fallen considerably over the past decades. With this, the share of illiterate children that come from families of illiterate parents have fallen too. Yet, in 2015, 10.6% of the children who had illiterate parents were also illiterate, a number three times larger than the figure for the children with literate parents (slightly below 3%).
In a way, if causality can be granted, 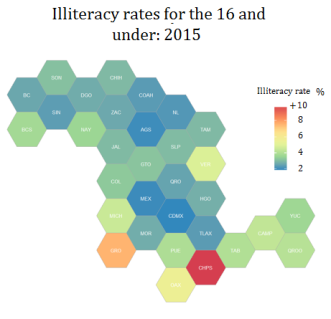 this can be seen as a measure of inter-generational transmission of this educational and
social ailment.
Despite progress in literacy, the map
to the right shows that illiteracy among the young is still high in some regions and states of the country. Not surprisingly, this is the case in those states in which poverty is more acute, namely the states of Chiapas, Guerrero, Oaxaca and Veracruz.
When we look at the whole population sample, one sees again that a pattern of educational exclusion emerges, with the south-west and the mountainous and indigenous regions of the country palpably worse off. The map below shows that in a vast number of municipalities illiteracy affects a large share of its population. This is a fact with important implications as poverty and illiteracy reinforce each other in a circular manner. Finding illiteracy rates this high is worrisome both for its consequences and for what they reveal about how lives go for people in many parts of the country.

(1) Maps built using data from “Encuesta Intercensal 2015” obtained from Instituto Nacional de Estadística y Geografía.
In Mexico, 80% of its population is deprived of at least one basic social and economic life dimension. Poverty in Mexico, regardless of how one measures it, is a widespread phenomenon that has grown on a par with population.
The poverty measure employed here focuses on seven categories, one of which is income, four others are cutoff indexes indicating whether individuals have access to health, education, food and social security and two others related to the quality of housing and access to basic housing services (such as running water or electricity). With these categories, a classification scheme for multidimensional poverty is constructed:

Despite this graph showing data of 2014, if one explores previews data it will find that little has changed in the composition of poverty over time. This is highly problematic as only one in five Mexicans live out of poverty hinting to the fact that social mobility is close to nonexistent.
Intergenerational transmission of social and economic conditions is perhaps in the core of understanding Mexico’s economic underperformance. When intergenerational transmission of poverty is elevated, many high skilled individuals will not fully materialize their potential and thus their contribution to society will be suboptimal. Thus, the degree at which individual’s social and economic development level is shaped by non-individual decisions partially determines how resources and opportunities are allocated. This in turn affects long run economic dynamics.
How we understand poverty can importantly influence how we come to measure it, how we analyse it and how we create policies to fight it. Poverty in Mexico is a critical social problem that Mexican governments have widely ignored and failed to tackle.
by Diego de la Fuente
Note: Data on poverty gathered from Coneval 2014.
 Mexico’s deep roots of poverty which have been systematically ignored by both the political and social spheres throughout its history. Over 23 million people live with an insufficient income to buy the minimum basket of food, even if they disposed all their income to do so; over 60 million cannot afford the minimum basket of goods and services.
Poverty is unevenly distributed across the population: with the indigenous, the rural and the youth populations being the most severely affected. In terms of the multidimensional poverty measure elaborated by CONEVAL which captures income together with six other indicators (access to food, edu
cation, housing, health and social security and basic services -such as water and sewage-), in the year 2012, poverty affected:
Poverty is hard to contextualize because more than a concept it is a way of life that is suffered distinctly across populations: in the rural and urban areas, by different age groups, across sexes, regions, climates, cultures, and so on. Some additional numbers should serve to make the point.

The problem of children is as obscure as those of the other groups but in a different way.
 According to INEGI, around three million Mexicans between 5 and 17 years old work (12.5% of the total), of which more than two thirds are boys. Of these, 44% do not receive an income, 28% earn an income below the minimum wage and only 8% earn more than 2 minimum wages for their work.
In Mexico, life is much harder for some that for others. However, it is striking is to find that poverty in Mexico is, more often than not, the result of exclusion. Looking at the level of need that large groups of the population have points towards the cyclical transmission of the problem across generations.
Paradoxically, the missing component for the country’s long waited economic flourishing lies precisely in whether the country is capable or not of unleashing individual potential across every group of society. Giving opportunities for development to the population would not only create a more just society but a much more dynamic one too.
by Diego de la Fuente
In the 1.96 million sq. kilometers of Mexican territory over 120 million people coexist. This is a country of great social, cultural and natural diversity such that is becomes hard to speak of a one Mexico. Along the territory, 67 stable languages are spoken among its various indigenous groups, making it the seventh most linguistically diverse country in the planet. According to CONEVAL (a Mexican government agency that evaluates social policy and measures poverty), around 9.7 percent of the Mexican population speaks an indigenous language. Heterogeneities in the welfare dimension abound too, with poverty being a widespread, yet differently lived, phenomenon.
Last official measures of income (2012) suggested that 51.6 percent of the total population lived with incomes below the poverty line. A level of poverty well above that of any other country with a similar average income. In fact, the share of the total population living under income poverty has not been significantly altered in the last 20 years as it affected a similar 53.1 percent in 1992. This is not to say that poverty has not increased: because of population growth there were more that 20 million additional people living under this type of poverty in 2012.
This is a reflection of the profound levels of opportunity and income inequality of the country. According to the OECD, a club of mostly rich countries, the top 10 percent income earners in Mexico held an income 30.5 times higher than the poorest 10 percent, in contrast with the 9.6 OECD average. Other measures portrait the same problem.
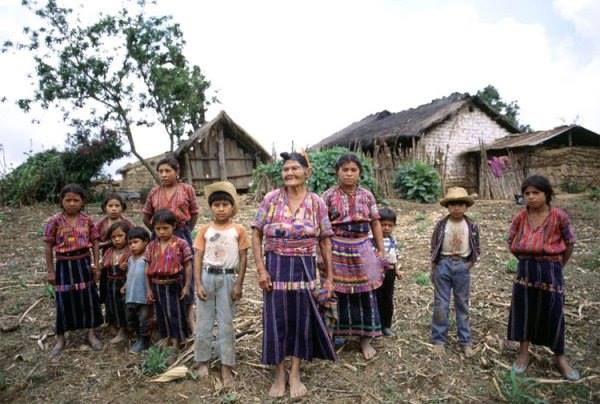 But not all groups are affected the same. Not only is poverty deeper in some regions of the country but it is also more widespread. For example, despite the fact that indigenous groups constitute little less than 10 percent of the total population, they accounted for 30.2 percent of the total population living under extreme poverty and 15.4 percent of the population living under general poverty (see graph below: “Poverty Levels Within Municipalities”). More worrisome is the fact that despite this being publicly known, in 2013 only 1.8 percent of the Federal budget was targeted to the development of indigenous towns and communities.
Poverty is the source of much of the current widespread social frustration as its origin has more to do with social exclusion, lack equal opportunities and an economic policy that lies far away from the multifaceted Mexican reality.
New figures of poverty are expected to be released in the coming weeks. Some expect the numbers of poverty to somewhat fall, specially those of extreme poverty since Federal programs such as “Sin Hambre” (Without hunger) -aimed to give basic food supplies to millions in need- have increased under the current administration. However, it is not clear their impact will be large and even if it is, the programs lack the capacity to break poverty in a structural manner. Some rightfully complain they are nothing more than meager palliatives.
Mexico has been used to tackling the problem in a rather superficial way, with doses of hurtful populism that are not rare to see in Latin America. Social policy needs to be better directed to break poverty in an organic manner. It should prioritize on those who need it the most; on those who have been excluded from the development of the economy for a long time. A policy for economic, social and cultural inclusion ought to be a priority.
Additional numbers:
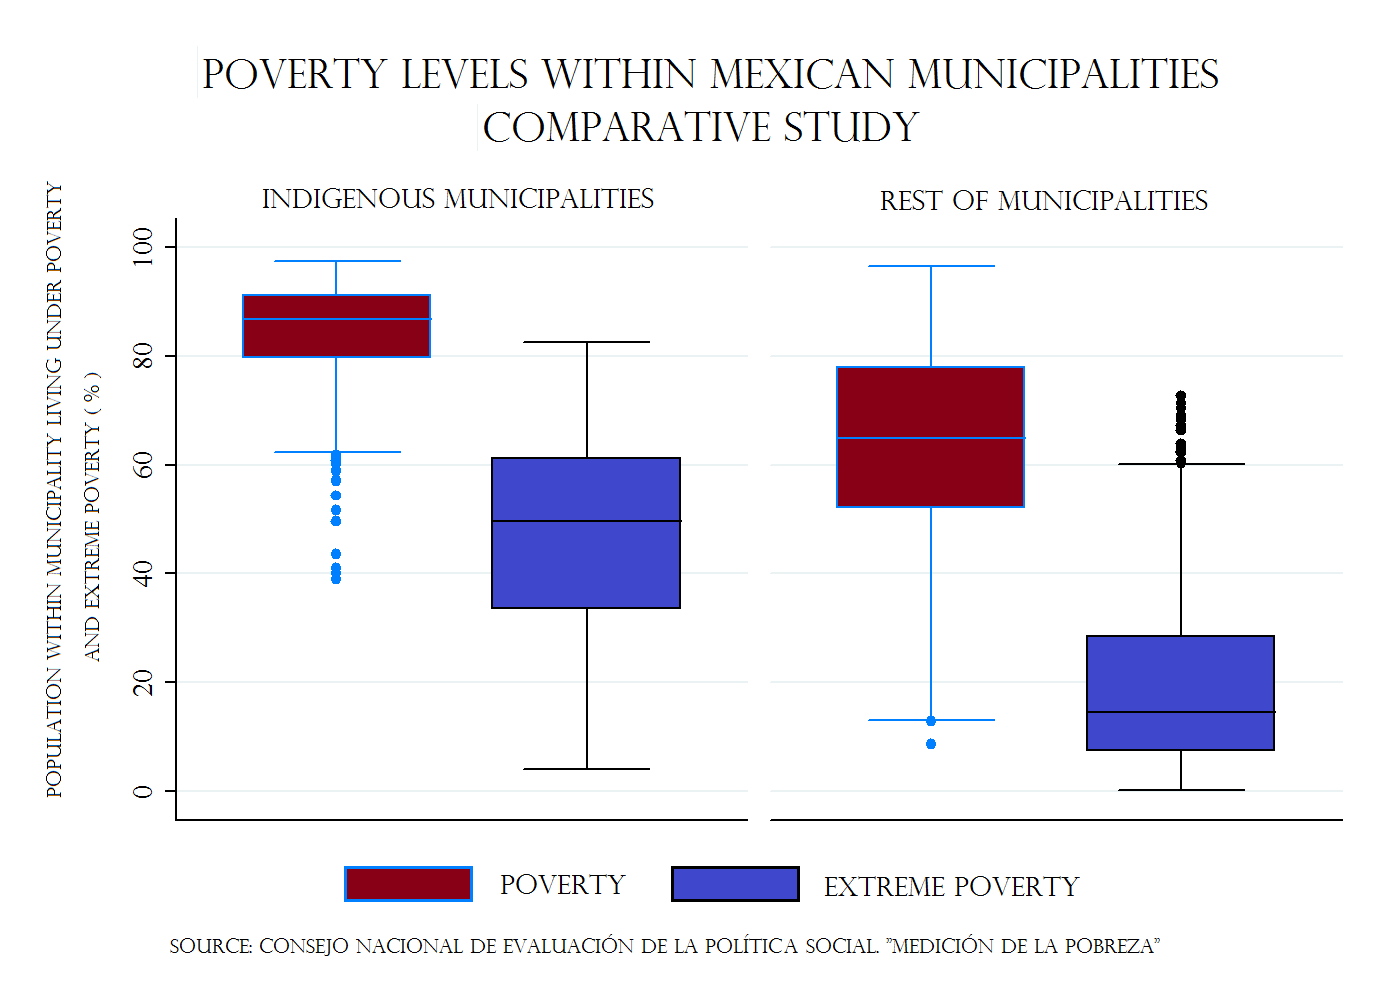
The following graph shows the distribution of municipalities according to the incidence of poverty within municipalities (vertical axis). Municipalities have been divided by the share of the population that speak an indigenous language. Municipalities are considered “indigenous” when over 70 percent of the population speaks an indigenous language. This graph allows us to see that in 75 percent of “indigenous” municipalities at least 80 percent of the population lives under (multidimensional) poverty while the exact reverse is true for the rest of municipalities. Something similar happens with extreme poverty: whereas in 50 percent of the indigenous municipalities over half of its population lives under extreme poverty in the corresponding in half of non-indigenous municipalities less than 15 percent of the population does.
Demography has uninterruptedly changed the course of human history. From the diaspora that led the formation of Ancient Greece to the aging populations of Japan and Europe. However, it is possible to assert that the speed of the demographic changes that North America has been going through is unprecedented.
The biggest change in this respect has been migration from the southern countries of Latin America to northern ones, particularly the United States. Not surprisingly, a large proportion of them come from Mexico since it accounts for over 30% of the Spanish speaking population in the Americas and shares a 3,145 km (1,954 mi) border with the United States, in many respects the most dynamic border in the world.
In fact, about one in ten Mexican citizens, 12m in total, live in the United States and despite ugly and divisive yet apparently fashionable political rhetoric half of them are legal and documented migrants. This makes for the biggest immigrant community in the world.
Has this migration come to a reach a new equilibrium? Between 1995 and 2000 some 3m Mexicans moved to the United States, vastly outnumbering the 700,000 or so who returned to Mexico. Yet in 2005-10 the number of newcomers fell to 1.4m, whereas that of returners increased to a matching 1.4m. Some estimates report that current net migration between these two countries has reversed. Much of this is likely to be the result of scarcer job prospects in the US, but not all.
Still, every year around 900,000 United States born citizens with Latin American heritage reach voting age. The effects of past migration are inevitable. The map that follows should help you visualize the size of the phenomenon.

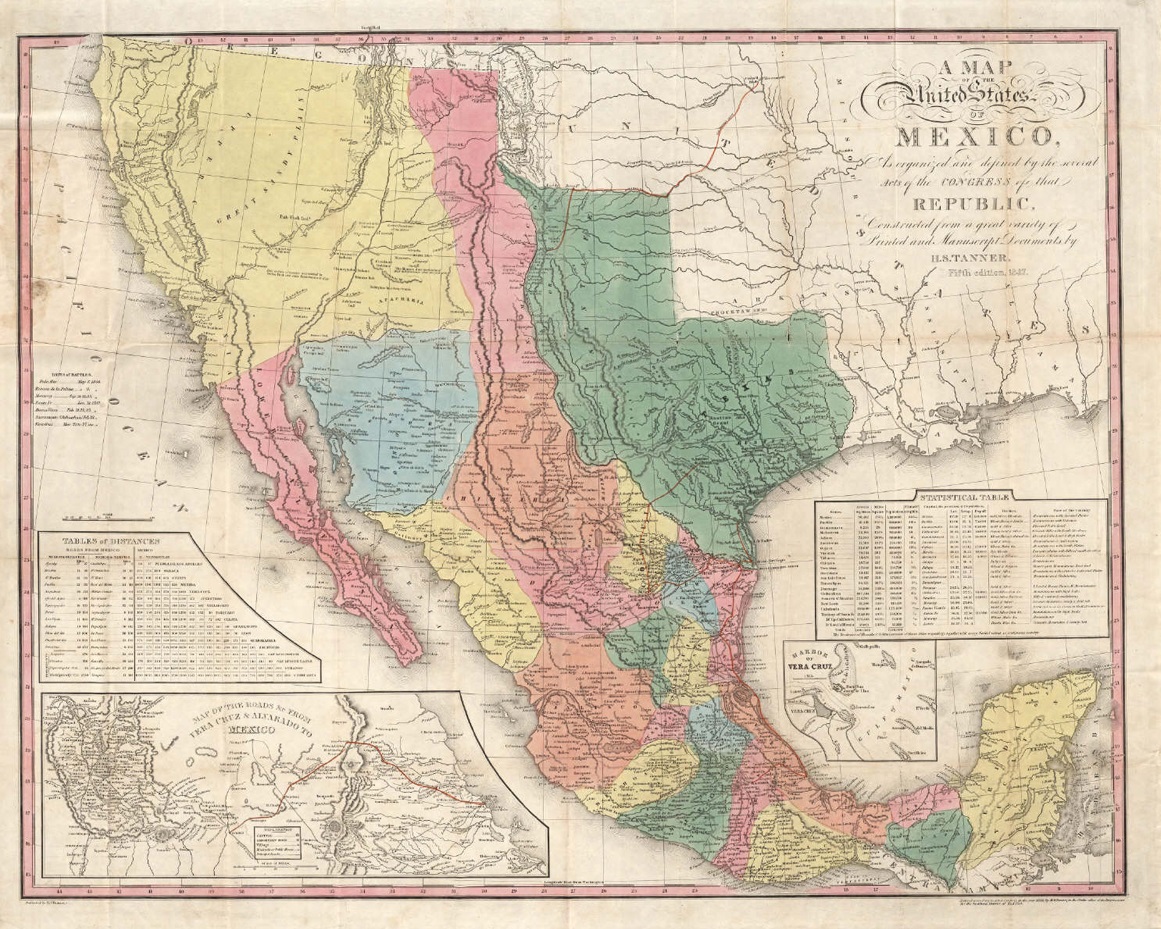
It is not uncommon that people find a connection between the previews map and that of the mid 19th century before the territorial disputes between the United States and Mexico that were settled between 1845 and 1848 to favor the rising US power. The map to the right plots the Mexican territory as claimed by Mexico.
by Diego de la Fuente
