Illiteracy in Mexico has fallen considerably over the past decades. With this, the share of illiterate children that come from families of illiterate parents have fallen too. Yet, in 2015, 10.6% of the children who had illiterate parents were also illiterate, a number three times larger than the figure for the children with literate parents (slightly below 3%).
In a way, if causality can be granted, 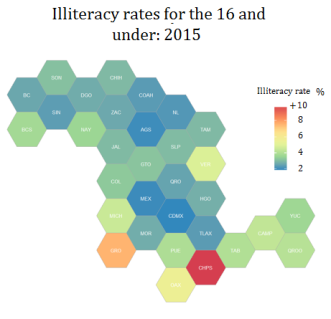 this can be seen as a measure of inter-generational transmission of this educational and
social ailment.
Despite progress in literacy, the map
to the right shows that illiteracy among the young is still high in some regions and states of the country. Not surprisingly, this is the case in those states in which poverty is more acute, namely the states of Chiapas, Guerrero, Oaxaca and Veracruz.
When we look at the whole population sample, one sees again that a pattern of educational exclusion emerges, with the south-west and the mountainous and indigenous regions of the country palpably worse off. The map below shows that in a vast number of municipalities illiteracy affects a large share of its population. This is a fact with important implications as poverty and illiteracy reinforce each other in a circular manner. Finding illiteracy rates this high is worrisome both for its consequences and for what they reveal about how lives go for people in many parts of the country.

(1) Maps built using data from “Encuesta Intercensal 2015” obtained from Instituto Nacional de Estadística y Geografía.
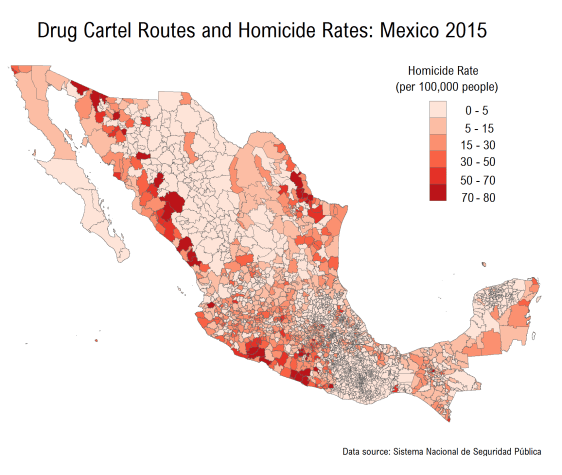
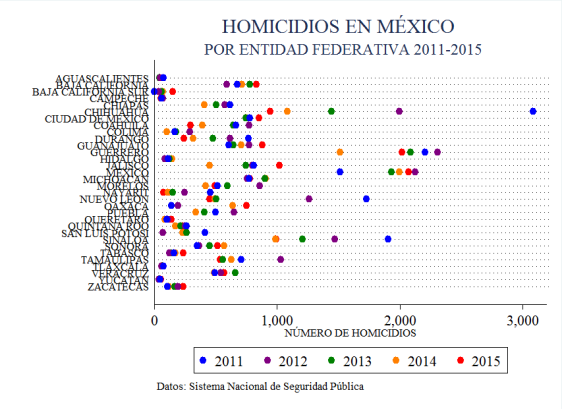
Homicides are one of the most violent manifestations of breakups in the social structure. While not all homicides are intentional, many are and these are the focus of this analysis.
Homicides respond to different dynamics and forces, in Mexico, many of these respond to drug cartel pressures. This can be seen in the map above -which plots homicide rates in each municipality (2456) for 2015. Murder rates are palpably higher in three areas well known to be linked to drug trafficking: two related to the US border and one in the central Pacific region (a spot through which precursors for manufacturing of synthetic drugs come into the country from Asia, mainly from China).
Homicide rates tend to be higher in regions disputed by more than one cartel. This why the policy to militarily dissolve the cartels often leads to spirals of violence. This approach destabilizes the long term equilibrium of territorial distribution by weakening incumbent cartels. As a consequence of this, new groups emerge and contest the domain of a particular region.
This is one reason that explains why the approach to drugs that the Mexican government decided to follow ten years ago has fatally failed. This failure can be measured in a number of ways: by the number of lives lost; the loss of economic opportunities; forced migration; budget devoted to the military and security rather than to socially valuable public goods, and so on. Under no metric does the social benefits brought by this strategy surpass its enormous social costs.
In the meantime, many countries have made strong steps to revert their policies towards more flexible drug production and consumption laws to treat the matter exclusively as a public health issue while taxing its consumption. There should be no doubt that the prohibitionist approach to drugs has been unequally enforced in different parts of the world. However, this gives more freedom to Mexico for reflecting about where it’s going and which path it wants to take in the future.
DFS
Demography has uninterruptedly changed the course of human history. From the diaspora that led the formation of Ancient Greece to the aging populations of Japan and Europe. However, it is possible to assert that the speed of the demographic changes that North America has been going through is unprecedented.
The biggest change in this respect has been migration from the southern countries of Latin America to northern ones, particularly the United States. Not surprisingly, a large proportion of them come from Mexico since it accounts for over 30% of the Spanish speaking population in the Americas and shares a 3,145 km (1,954 mi) border with the United States, in many respects the most dynamic border in the world.
In fact, about one in ten Mexican citizens, 12m in total, live in the United States and despite ugly and divisive yet apparently fashionable political rhetoric half of them are legal and documented migrants. This makes for the biggest immigrant community in the world.
Has this migration come to a reach a new equilibrium? Between 1995 and 2000 some 3m Mexicans moved to the United States, vastly outnumbering the 700,000 or so who returned to Mexico. Yet in 2005-10 the number of newcomers fell to 1.4m, whereas that of returners increased to a matching 1.4m. Some estimates report that current net migration between these two countries has reversed. Much of this is likely to be the result of scarcer job prospects in the US, but not all.
Still, every year around 900,000 United States born citizens with Latin American heritage reach voting age. The effects of past migration are inevitable. The map that follows should help you visualize the size of the phenomenon.

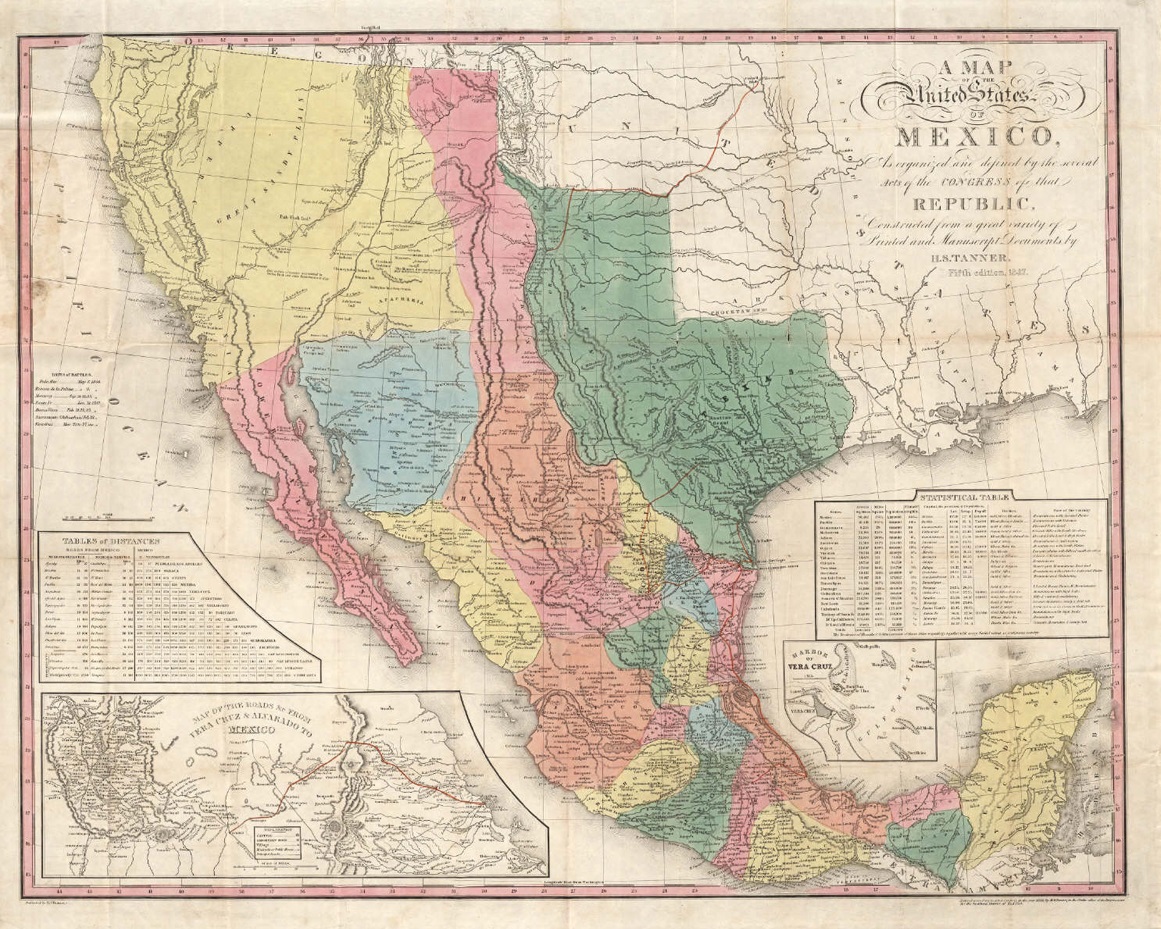
It is not uncommon that people find a connection between the previews map and that of the mid 19th century before the territorial disputes between the United States and Mexico that were settled between 1845 and 1848 to favor the rising US power. The map to the right plots the Mexican territory as claimed by Mexico.
by Diego de la Fuente
