Rplot09

Tasa semanal de muertes por Covid19 en cada uno de las entidades federativas de México. Sin duda la Ciudad de México y Baja California han mostrado la mayor incidencia letal del virus, habiendo semanas con 6 defunciones por cada 100,000 habitantes. Como comparativo, la tasa anual de homicidios (nacional) es de 29 por cada 100,000 habitantes. Otros estados como Tabasco, Sinaloa (y ya pasado Quintana Roo) muestran problemas. Falta ver Guerrero, Chiapas y Oaxaca, quienes van a la alza y cuentan con los sistemas de salud más pauperizados del país.

remesas_anuales

Las remesas internacionales son una de las principales fuentes de ingreso de México. Esta gráfica muestra el flujo anual de remesas a México desde que hay registro (1995) hasta 2018.

remesas_presidencial

Son de tal dimensión que en el sexenio de EPN (2012-2018) las remesas superaron los 150 mil millones de dólares.


Lenguas originarias de México

Una muestra de la inmensidad de México es su diversidad cultural, expresada aquí a través de las lenguas originarias del país. Existen siete ramas aisladas de las que derivan más de medio centenar de lenguas además de tres importantes lenguas más aisladas. Algunas muertas, otras con más de un millón de personas hablándola.

Otomangueanas_YutoAztecas_Hokanas_Maya_Otras_Zoqueanas_REARANGED


Lenguas Otomangueanas

La familia lingüística otomangueana está presente en el centro y sur de México por lo menos desde el año 2000 a. C. Su historia y extensión han dado como resultado una notable divergencia lingüística entre los grupos que la componen.

El diagrama muestra las dos vertientes del Otomangue: el oriental y occidental. De éstas derivan más de veinte variantes lingüísticas adicionales. Las más grandes son el Tlapaneco, Otomí, Mazahua, Zapoteco, Mixteco y el Mazateco. El número* de personas que hablan cada lengua es reflejado en el grueso de los nodos, habiendo al menos cinco lenguas muertas y otras siete en peligro de extinción.

lenguas_otomanguanasblack


Lenguas Yuto-Azteca

Madre de las importantes lenguas Nahuatl, Trahumara, Yaqui, Mayo y Huichol. También madre de las lenguas muertas Pochuteco, Ópata, Tubar, Eudeve y Tepecano. Una lengua que tiene tres ramas vivas. La rama dominante es el “Carachol-Aztecano”, tanto el Nahuatl (la lengua más hablada entre todas las lenguas) como el Huichol son escisiones de ella. Taracachita tiene a su vez tres ramificaciones, dos de mediano tamaño y una vertiente extinta.

lenguas_yutoaztecas


Lenguas Mayenses

Con un grado de diversificación que sugiere antigüedad pentamilenaria. De compleja escritura, en parte logográfica y en parte silábica. Ubicada principalmente en el sur de México, Belice y Guatemala, el maya es un complejo conjunto de lenguas vivas. Tres de sus cinco ramas principales tienen poblaciones importantes, siendo el maya yucateco la segunda lengua más hablada en el país.

lenguas_mayasblack


Lenguas Hokanas

Esta rama agrupa numerosas lenguas habladas en las zonas áridas del noroeste de México. La mayor parte de las lenguas hokanas están extintas o se encuentran cerca de desaparecer.

lenguas_hokanasblack


Lenguas Toto-Zoqueanas

Esta familia de lenguas constituye la unión de las subfamilias lingüísticas totonaco-tepehua y mixe-zoque. El primer grupo es formado por siete lenguas y hablado por los totonacos. Se habla en la Sierra Madre Oriental, principalmente entre los estados de Veracruz y Puebla, por alrededor de 200 mil habitantes. Por su parte las lenguas mixe-zoqueanas, son habladas en el istmo de Tehuantepec, la Sierra de Juárez y el occidente de Chiapas.

lenguas_totozoqueanasblack


Lenguas Varias

lenguas_variasblack


*El número de personas ha sido reconvertido con una escala logarítmica, preservando así sus propiedades de monotonicidad, con fines de visualización.


Illiteracy in Mexico: 2015

Illiteracy in Mexico has fallen considerably over the past decades. With this, the share of illiterate children that come from families of illiterate parents have fallen too. Yet, in 2015, 10.6% of the children who had illiterate parents were also illiterate, a number three times larger than the figure for the children with literate parents (slightly below 3%).
In a way, if causality can be granted, Illitracy2015_Children_Map_ByState_EPOCAthis can be seen as a measure of inter-generational transmission of this educational and
social ailment.

Despite progress in literacy, the map
to the right shows that illiteracy among the young is still high in some regions and states of the country. Not surprisingly, this is the case in those states in which poverty is more acute, namely the states of Chiapas, Guerrero, Oaxaca and Veracruz.

When we look at the whole population sample, one sees again that a pattern of educational exclusion emerges, with the south-west and the mountainous and indigenous regions of the country palpably worse off. The map below shows that in a vast number of municipalities illiteracy affects a large share of its population. This is a fact with important implications as poverty and illiteracy reinforce each other in a circular manner. Finding illiteracy rates this high is worrisome both for its consequences and for what they reveal about how lives go for people in many parts of the country.

Illiteracy2015_MunicipalityLevel_edited

(1) Maps built using data from “Encuesta Intercensal 2015” obtained from Instituto Nacional de Estadística y Geografía.

Economics of Temporal Migrations

migration

Many migrations are temporal, a fact that is often ignored in both the public discourse and the economic literature on migration. Such omission is serious as temporariness of migration affects almost every aspect of immigrants’ life cycle decisions as well as the composition of the remaining migrant population. Failure to include temporal migration into consideration will likely drive to fallacious conclusions due to the dimensions of the phenomenon. A recent OECD report points that, depending on the country and time frame studied, 20 to 50 percent of immigrants leave the host country within the first five years after arrival.[1]

Before proceeding to the topic of temporal migration, let’s step back to distinguish migrants by reason of migration. One can claim that immigration occurs for two reasons: driven by economic motives or by the necessity to escape the country of origin.  Despite increased attention to the second type of migrants, which we shall call refugees, most migrants move from their country of origin for economic motives. Because of this, this analysis will centre in the kind of immigrants who choose to move in search of a job, escape poverty, gain a set of skills they find valuable and so on. Conceptually these two types of migration are very different. Here I shall attempt to elucidate some of the features that make temporal, economic driven migrants so different.

Outmigration in not consequence free. One obvious implication regards the selection of migrants and thus the composition of migrants. That is, migrants who decide to stay are more likely to be similar across them than across those who decide to migrate (on average, at least). Then, one important question is which immigrants return and which migrants stay. To put it differently, are migrants positively or negatively selected? This will depend mainly (while not exclusively) on two main features: before migration skills and re-emigration plans. Of course, plans and ex-post realizations often differ. However, choices made during the stay of migration are largely determined by the expectation of the temporariness of their migration. Moreover, it has been found that expected migration length and actual duration realization is not very different.

Empirical literature has found that intended duration of migration affects assimilation efforts and consumption patterns which in turn affects employment outcomes too. By assimilation efforts one can think of willingness to learn a language, efforts to extend social network, investment in valuable local skills and so on. For example,  Christian Dustmann has shown that those with non-permanent intentions to stay do invest less in language capital, as opposed to permanent migrants.[2] It is not hard to see how assimilation profiles is correlated with employment prospects and thus earnings growth.

Evidence shows that temporal immigrants have flatter earnings profiles than permanent ones.[3] Regarding consumption, economic analysis suggests that temporal migrants are more likely to over-save during migration while permanent migrants spread consumption more equally over their life cycle.[4] Importantly, because temporary immigrants are more likely to leave their families behind, temporary migrants are more likely to hold assets in their home countries and thus to send more remittances too. Such transfers may have important consequences for the home country.
Remittances Banco de Mexico
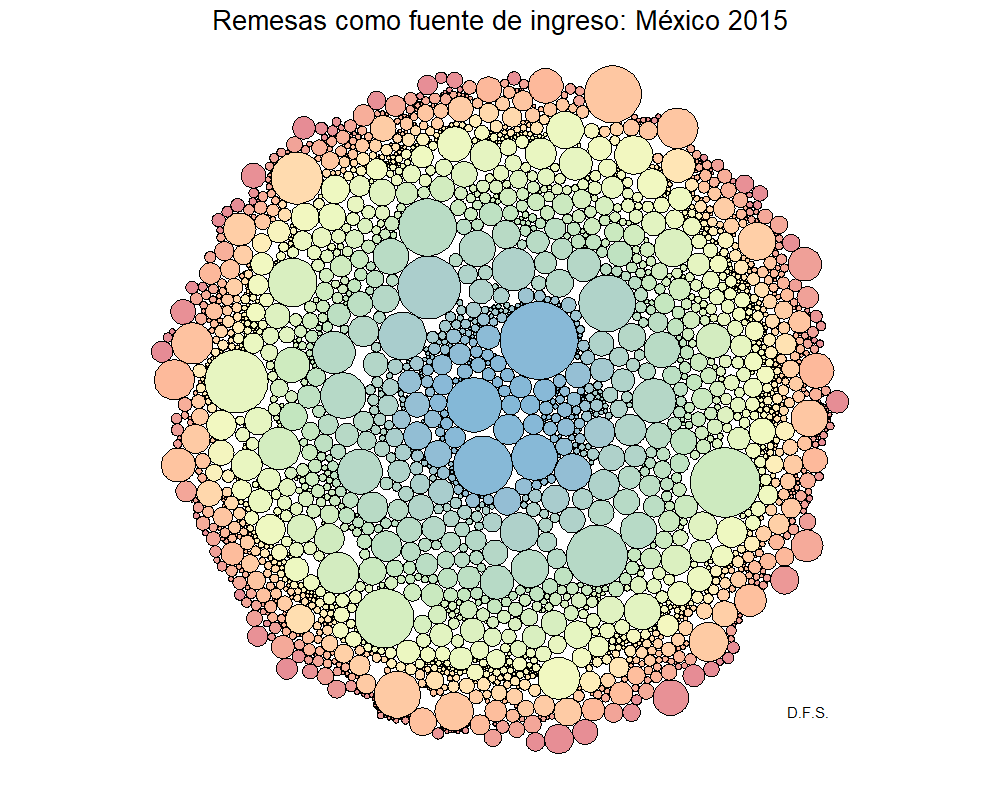
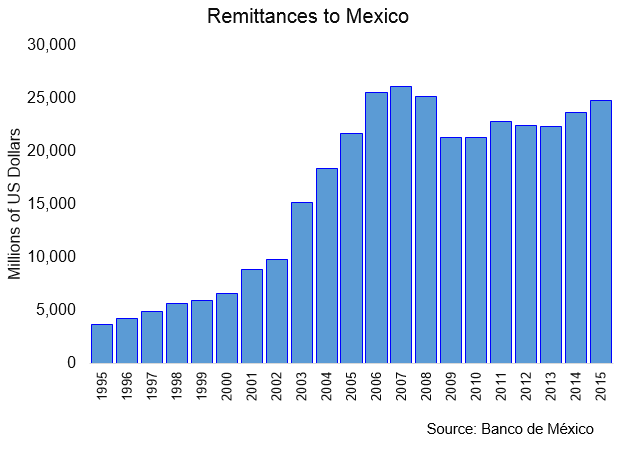
Arguably, the most important channel by which migration affects the sending country is via remittances (or transfers from the immigration country to the immigrant’s home country). For example, according to Mexico’s central bank (see figure), reported Mexicans overseas sent nearly $24.8 billion home in 2015, overtaking oil revenues for the first time as a source of foreign income.

Migration can have negative effects for the sending country too. One obvious channel is via the brain drain effect. That is, by a reduction in the per capita human capital in the home country. However, this can be mitigated and even reversed by returning migrants if their gained skills abroad are highly valued in the country of origin. On the other hand, temporary migrants tend to spend their most productive years in the host country, while spending costly childhood and retirement years in the country of origin. This effect is opposite for the receiving country, as the high fiscal burden that aging brings about is borne by the country in which migrants settle for retirement. It is estimated that average annual social expenditure for working-age population, in OECD countries, is twice as high for children and six times as high for individuals over 65.

Why temporal migration occurs introduces additional complexities to the analysis. One can think of circular migrations, as is often the case with Mexican agricultural migrants in the United States, student migrations, or migrants who wish to save for later investments in their home countries. However, in almost every case in which the decision to re-emigrate is made endogenously by the migrant and is free of unexpected shocks, the reason falls back to an intrinsic preference for their home country or to a high return for the skills acquired during migration in the country of origin. Intuitively, the decision revolves around the trade-off a migrant faces between the benefits of staying longer and the loss of foregone utility from spending additional time in the host country.

Implications of temporary versus permanent migrations follow directly from the behavioural consequences between the two types and to selection of out-migration. Temporary migrants may invest less in social and human capital, having potentially large consequences for their assimilation and earnings profile. Temporary migrations are also likely to affect wages and employment of natives in destination countries differently for permanent migrations, how this occurs will depend on who emigrates, and where emigrants are located along the native skill and wage distribution. Of course each case will vary in both the time and space dimension for which any attempt to make universal conclusions needs to be taken with caution. Here I attempt to stress the fact that return migration is perhaps a norm rather than an exception a fact that conveys large consequences for both the sending and receiving countries.


by Diego de la Fuente


References:

[1] Organisation for Economic Cooperation and Development. International Migration Outlook 2008. OECD publishing

[2] Dustmann, C. (1999).  “Temporary Migration, Human Capital, and Language Fluency of Migrants.” Scandinavian Journal of Economics 10.2: 297-314

[3] Dustmann and Gorlach (2015). “The Economics of Temporary Migrations.” Journal of Economic Literature (forthcoming). 

[4] Bauer, T. and Sinning, M. (2011) “The Savings Behaviour of Temporary and Permanent Migrants in Germany.” Journal of Population Economics 24.2: 421-499

Poverty in Mexico I

In the 1.96 million sq. kilometers of Mexican territory over 120 million people coexist. This is a country of great social, cultural and natural diversity such that is becomes hard to speak of a one Mexico. Along the territory, 67 stable languages are spoken among its various indigenous groups, making it the seventh most linguistically diverse country in the planet. According to CONEVAL (a Mexican government agency that evaluates social policy and measures poverty), around 9.7 percent of the Mexican population speaks an indigenous language. Heterogeneities in the welfare dimension abound too, with poverty being a widespread, yet differently lived, phenomenon.

indigenas-mejico-

Last official measures of income (2012) suggested that 51.6 percent of the total population lived with incomes below the poverty line. A level of poverty well above that of any other country with a similar average income. In fact, the share of the total population living under income poverty has not been significantly altered in the last 20 years as it affected a similar 53.1 percent in 1992. This is not to say that poverty has not increased: because of population growth there were more that 20 million additional people living under this type of poverty in 2012.

This is a reflection of the profound levels of opportunity and income inequality of the country. According to the OECD, a club of mostly rich countries, the top 10 percent income earners in Mexico held an income 30.5 times higher than the poorest 10 percent, in contrast with the 9.6 OECD average. Other measures portrait the same problem.

10354745_699662983422490_6674093125968396564_nBut not all groups are affected the same. Not only is poverty deeper in some regions of the country but it is also more widespread. For example, despite the fact that indigenous groups constitute little less than 10 percent of the total population, they accounted for 30.2 percent of the total population living under extreme poverty and 15.4 percent of the population living under general poverty (see graph below: “Poverty Levels Within Municipalities”). More worrisome is the fact that despite this being publicly known, in 2013 only 1.8 percent of the Federal budget was targeted to the development of indigenous towns and communities.

Poverty is the source of much of the current widespread social frustration as its origin has more to do with social exclusion, lack equal opportunities and an economic policy that lies far away from the multifaceted Mexican reality.

New figures of poverty are expected to be released in the coming weeks. Some expect the numbers of poverty to somewhat fall, specially those of extreme poverty since Federal programs such as “Sin Hambre” (Without hunger) -aimed to give basic food supplies to millions in need- have increased under the current administration. However, it is not clear their impact will be large and even if it is, the programs lack the capacity to break poverty in a structural manner. Some rightfully complain they are nothing more than meager palliatives.

Mexico has been used to tackling the problem in a rather superficial way, with doses of hurtful populism that are not rare to see in Latin America. Social policy needs to be better directed to break poverty in an organic manner. It should prioritize on those who need it the most; on those who have been excluded from the development of the economy for a long time. A policy for economic, social and cultural inclusion ought to be a priority.


Additional numbers:

Figura 3 (.wmf) - Indigenismo, desigualdad y pobreza en México

The following graph shows the distribution of municipalities according to the incidence of poverty within municipalities (vertical axis). Municipalities have been divided by the share of the population that speak an indigenous language. Municipalities are considered “indigenous” when over 70 percent of the population speaks an indigenous language. This graph allows us to see that in 75 percent of “indigenous” municipalities at least 80 percent of the population lives under (multidimensional) poverty while the exact reverse is true for the rest of municipalities. Something similar happens with extreme poverty: whereas in 50 percent of the indigenous municipalities over half of its population lives under extreme poverty in the corresponding in half of non-indigenous municipalities less than 15 percent of the population does.